|
|
|
Main Page / Articles / Links /Visit our News Page
Facts You Can UseViolent Crime
Decreasing Violent Crime
Firearm Use in Violent Crime
Knives--Increased Usage
Murder and Firearms
U.S. Murder Rate: 1900 to 1997
Murder Rate Highest in Anti-Gun Cities
Civilian Use of Firearms to Deter Crime
Concealed Weapons
Juveniles & Violent Crime
Juvenile Murder Victims--Weapons Used
Juvenile Murder Offenders' Ages
Gun Ownership and Violent Crime
Unintentional Firearm Deaths and Rates, Ages 0 to 14
Firearms: Safety and Death Statistics
Firearms-Related Death Rate by Age
Accidental Firearms Deaths Compared to Other Causes
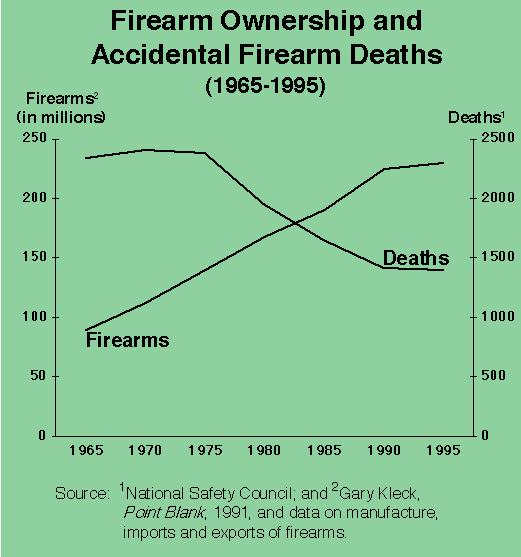
Firearm Ownership and Accident Death Rates
Most Common Activities Leading to Emergency Room Visits
Causes of Police Officer Deaths (U.S.)
Suicide
U.S. and International Murder Rates Compared
Suicide and Murder Rates in 86 Nations
U.S. and Japan's Murder and Suicide Rates Compared
Defensive Gun Uses
Gun Ownership Statistics
Total Firearms
Fully Automatic Firearms
Kellermann Study debunked
Other Research & Data Sources
Decreasing Violent Crime
According to the FBI's 1998 Uniform Crime Reports (released in October, 1999), from 1997 to 1998:Firearm Use In Violent Crime: More significantly, despite the fact the number of firearms and handguns owned by individual Americans continued to increase from 1997 to 1998, the F.B.I. also reported:Overall violent crime: the overall violent crime rate in the U.S. decreased by 7.3 percent. Murders: In 1997, there were a total of 18,208 murders in the U.S.; in 1998, there were 16,914. [source: FBI's 1998 Uniform Crime Reports, page 13] Murder Rate: From 1997 to 1998, the murder rate decreased by 7.4 percent from 6.8 per 100,000 to 6.3 per 100,000 population, the lowest since 1967 (when the rate was 6.2). Robbery: From 1997 to 1998, the robbery rate declined by 11.3 percent to 165.2 per 100,000, the lowest since 1969 (when the rate was 148.4). Please click here to view the F.B.I.'s 1998 Uniform Crime Reports.Decrease in Firearm Murders: In 1997, of the 15,837 murders as to which the type of weapon used was known to the F.B.I., 10,729 were committed with firearms; in 1998, 14,088 murders in which the type of weapon used was known, 9,143 were committed with firearms. Decrease in Rate of Firearm Murders: Thus, the rate of firearms used to commit murders decreased from 67.8 percent (of murders in which the type of weapon used was known to the F.B.I.) in 1997, to 64.9 percent in 1998. Firearms vs. Other Weapons in 1998 (total numbers): Extrapolating these rates to the total number of murders in 1998 (as opposed to just the murders in which the type of weapon used was known), 10,977 of the total 16,914 murders apparently involved the use of firearms, and 5.937 involved other types of weapons. Firearms vs. Other Weapons in 1998 (rate per 100,000): In 1998, there were 4.1 (per 100,000 population) murders involving the use of firearms, and 2.2 (per 100,000) murders involving weapons other than firearms.
[Note: it is instructive to compare the non-firearms murder rate in the U.S. to the total murder rates in those countries which have strict gun control; e.g., Japan, where the total murder rate of .6 per 100,000 is about one quarter of the non-firearms murder rate in the U.S. This proves that the absence of firearms does not lead to lower murder rates. Click here to examine these data.]
Knives--Increased Usage: By contrast, the FBI also reports that the percentage of murders involving knives is on the rise. Knives were used in 13.3 percent of the murders committed in the United States in 1998 as compared to 12.7 percent of murders in 1994. Decrease in Use of Firearms in Robberies: The rate of firearms used to commit robberies decreased from 39.7 in 1997 to 38.2 in 1998. Murder Rate and Firearms
As reported in the May 25, 1998, edition of U.S. News & World Report, according to the F.B.I., the murder rate in the U.S. dropped 20 percent--from 24,526 to 19,645--from 1993 to 1996. There was an additional nine percent drop in 1997.The murder rate in 1993 was 9.5 per 100,000; in 1996 it went down to 7.4 per 100,000. (Source: May 25, 1998, edition of U.S. News & World Report)
Although exact figures are not known, firearm ownership increased since 1994 by as much as 2.5 million per year, while, as shown above, the murder rate decreased during that period. This conclusively shows firearms do not lead to higher murder rates. (Source: May 25, 1998, edition of U.S. News & World Report)
In 1995, there were a total of 22,552 homicides (which would include murders, but exclude the 343 "legal interventions") in the U.S. Of these, 15,551, or 69 percent, involved the use of a firearm. The percentage of firearms-related homicide decreased from 71 percent in 1994. By 1998, the rate of firearms use in murder was down to 64.9 (Source: National Safety Council's 1998 Accident Facts; F.B.I.'s 1998 Uniform Crime Reports)
In 1995, there were 3.3 non-fatal firearms related injuries for each death. (Source: National Safety Council's 1998 Accident Facts)
U.S. Murder Rate Since 1900
(Rate shown is per 100.000 population)
1900 1.2 |
1950 5.3 |
[Source: National Center for Health Statistics, Vital Statistics, Revised July, 1999]Notes: The murder rate peaked in the mid-1930s and again in 1980. These facts also show there is no correlation between the 1939 National Firearms Act (NFA), which imposed stringent regulations on fully automatic weapons, or the 1968 Gun Control Act (GCA), and the murder rate. In fact, the murder rate skyrocketed in the 12 years following enactment of the 1968 GCA.
In 1900 there were few gun laws. New York had no handgun law and California no waiting period. Guns of all types could be ordered by mail or bought anonymously. And the homicide rate was 1.2, about one-sixth of what it is today. The homicide rate peaked in 1933, during the Depression, and then fell. It was low during and after World War II, but began to rise in the 1960s and 1970s, and reached its high for this century, 10.7, in 1980. It then fell to 8.3 in 1985, a fall of 22%. This welcome news was virtually ignored by the media, which emphasize rises in violence but downplay decreases. Homicide rose again in the late 1980s, but not to its 1980 high. The homicide rate continued to rise following the Gun Control Act of 1968, while the fall in the early 1980s occurred when anti-crime laws but no new anti-gun laws were passed.
It is also significant that from 1900, the number of firearms owned by Americans continued to increase throughout the 20th Century, but the murder rate fluctuated. By the end of the century, the murder rate had decreased to a 30-year low. This conclusively shows the availability of firearms is unrelated to the murder rate; i.e., firearms do not lead to increased violent crime rates.
Murder Rate Highest in Anti-Gun Metropolitan Areas
Baltimore, Detroit, Los Angeles, New York, Philadelphia and Washington, D.C. have perhaps the most repressive laws regarding firearm ownership and possession by citizens. Not surprisingly, in 1998, these areas also had some of the highest murder rates:
City |
Population |
Total No. of Murders |
Murder Rate |
Baltimore, MD |
662,253 |
312 |
47.1 |
Detroit, MI |
999,976 |
430 |
43 |
Los Angeles, CA |
3,621,680 |
426 |
11.8 |
New York, NY |
7,357,745 |
633 |
8.6 |
Philadelphia, PA |
1,449,419 |
338 |
23.3 |
Washington, D.C. |
523,000 |
260 |
49.7 |
In addition, in 1998, these cities had a combined population of 14,614,073, which is approximately 5.6 percent of the total U.S. population of 259 million. They also had a combined murder total of 2,399, which was about 14.2 percent of the total murders in the U.S. for that year (16,914 total U.S. murders in 1998).A common response to the statement that the cities with the most repressive firearms laws have the highest violent crime rates is that criminals obviously go into surrounding cities or states to obtain their firearms since the laws there are more relaxed and firearms more readily available. What destroys this argument is the fact that, without exception, those areas where firearms are more readily available and the firearms laws more liberal have lower violent crime rates.
[source: FBI's 1998 Uniform Crime Reports]
Firearm Use by Civilians to Deter Crime
By carefully examining facts and statistics from the Department of Justice, the F.B.I. and other law enforcement agencies, Prof. Gary Kleck from the School of Criminology, Florida State University, discovered Americans use firearms to prevent crimes approximately 1 to 1.5 million times per year. These are the very cases Kellermann chose to ignore. Had Kellermann considered these facts, he would have had to conclude a firearm in the home makes a family safer.Prof. Kleck also discovered that robbery victims who defended themselves with a gun suffered lower rates of injury than did those who resisted without a gun, or even those who did not resist at all and instead complied with the violent criminal's demands. In short, Prof. Kleck concluded the private ownership of firearms deters criminal behavior. (Source: "Crime Control Through the Private Use of Armed Force" by Gary Kleck)
Concealed Weapons Permit Laws
Liberalized concealed-carry handgun laws, now in effect in 31 states, are a major factor in reducing violent crime. This was proven by University of Chicago by Professors John Lott and David Mustard in their landmark 1996 study, "Crime, Deterrence and Right-to-Carry Concealed Handguns." The researchers examined crime in the more than 3,000 U.S. counties from 1977 to 1992 and discovered liberalized concealed-carry laws reduced murders by 8.5 percent, rapes by 5 percent and aggravated assaults by 7 percent.Juvenile Murder Victims 1997--Weapons Used
[Note: The following figures are actual numbers, not as a rate or percentage]
Age of Victim |
Personal Weapons (hands, feet) |
Blunt Objects |
Firearms |
Knives |
Other/Unknown |
Total |
Infant |
111 |
17 |
3 |
2 |
87 |
220 |
1 to 4 |
155 |
23 |
43 |
13 |
89 |
323 |
5 to 8 |
24 |
5 |
30 |
11 |
37 |
107 |
9 to 12 |
9 |
5 |
45 |
14 |
28 |
101 |
13 to 16 |
20 |
19 |
352 |
43 |
46 |
480 |
Totals |
319 |
69 |
473 |
83 |
287 |
1231 |
[Source: 1998 Uniform Crime Reports, Table 2.11]Juvenile Murder Offenders
[Note: The following figures are actual numbers, not as a rate or percentage]
Age Group |
|
Infant |
0 |
1 to 4 |
1 |
5 to 8 |
4 |
9 to 12 |
17 |
13 to 16 |
594 |
17 to 19 |
2,009 |
[Source: 1998 Uniform Crime Reports, Table 2.6]Gun Ownership and Violent Crime
Research from the U.S. Department of Justice confirms that responsible gun ownership by boys leads to lower crime rates. Specifically, the Dept. of Justice found that boys who who own legal firearms have much lower rates of delinquency and drug use than do boys who own "illegal" guns, and are even slightly less delinquent than non-owners of guns. Here are the data:
Status |
Street Crime |
Gun Crimes |
Drug Abuse |
No guns owned |
24 |
1 |
15 |
"Illegal" guns only |
74 |
24 |
14 |
Guns Legally Owned |
14 |
0 |
13 |
Note: these figures represent the percentage of each category's involvement in street crime, gun crimes and drug abuse.The Dept. of Justice concluded that boys who owned guns legally were less likely to become involved with criminal activity, when compared to either boys who owned illegal guns or even boys who owned no guns, in part because of the different ways in which they were "socializ[ed] into gun ownership" and the fact they typically had "fathers who own guns for sport and hunting."
[source: "Urban Delinquency and Substance Abuse: Initial Findings--Research Summary," published by the Justice Department's Office of Juvenile Justice and Delinquency Prevention in March 1994.]
Accidental Firearm Deaths and Rates, Ages 0 to 14 (rate is per 100,000)
Age Group |
1997 Deaths |
Rate |
1996 Deaths |
Rate |
1995 Deaths |
Rate |
1994 Deaths |
Rate |
0-4 |
20 |
0.10 |
17 |
0.09 |
20 |
0.10 |
34 |
0.17 |
5-9 |
28 |
0.14 |
27 |
0.14 |
32 |
0.17 |
25 |
0.13 |
10-14 |
94 |
0.49 |
94 |
0.50 |
129 |
0.69 |
126 |
0.67 |
[Source: U.S. Centers for Disease Control]For more information on juveniles and crime, visit: Violentkids.Com
Firearms-Related Death Rate by Age
In 1997 (the most recent year for which data is available), there were 1,500 accidental deaths involving firearms in the U.S. This is a rate of .6 per 100,000. (Source: National Safety Council's 1998 Accident Facts)Age breakdown for accidental shooting deaths in 1996:
0-4 years: 40 deaths
5-14 years: 180 deaths
15-24 years: 450 deaths
25-44 years: 450 deaths
45-64 years: 240 deaths
65-74 years: 80 deaths
75+ years: 60 deaths
[Source: National Safety Council's 1998 Accident Facts]See also: Unintentional Firearm Deaths and Rates Ages 0 to 14
In 1995, there were 12.8 non-fatal firearms related injury for each accidental death. (Source: National Safety Council's 1998 Accident Facts)
Accidental Firearms-Related Deaths Compared to Other Causes of Accidental Death (1997)
1. Motor vehicles: 43,200 deaths
2. Falls: 14,900 deaths
3. Poisoning by solids or liquids: 8,600 deaths
4. Drowning: 4,000 deaths
5. Fires, burns and related deaths: 3,700 deaths
6. Suffocation by swallowing object: 3,300 deaths
7. Firearms-related: 1,500 deaths
8. Poisoning by gases and vapors: 700 deaths
9. All other causes (including medical "misadventures"): 13,900
Total deaths: 93,800
(Source: National Safety Council's 1998 Accident Facts)The Most Common Activities that Lead to Emergency Room Visits
1. Baseball/softball 404,000
2. Dog bites 334,000
3. Playground 267,000
4. ATV's, mopeds 125,000
5. Volleyball 98,000
6. In-line skating 76,000
7. Horseback riding 71,000
8. Baby walkers 28,000
9. Skateboards 25,000Note: There is no mention of guns or shooting activities
[Source: U.S. Consumer Product Safety Commission]
1999 Total Line of Duty Deaths: 108
Accident (Unclassified): 1
Aircraft Accident: 4
Assault: 1
Automobile Accident: 36
Fall: 1
Gunfire: 39
Gunfire(Accidental): 2
Heart Attack: 11
Motorcycle Accident: 5
Struck by Train: 1
Struck by Vehicle: 6
Weather Related: 11998 Total Line of Duty Deaths: 170
Accident (Unclassified): 1
Aircraft Accident: 4
Assault: 1
Automobile Accident: 49
Boating Accident: 1
Bomb: 1
Drowned: 8
Gunfire: 62
Gunfire (Accidental): 3
Heart Attack: 18
Motorcycle Accident: 4
Natural Disaster: 3
Struck by Train: 1
Struck by Vehicle: 14Notes: Automobile collisions, accidents and heart attacks account for an estimated 66 percent of the deaths in 1999, and 39 percent in 1998.
[Source: L.A.P.D.]
1997 (the last year for which there are statistics available): guns were used in 17,566 suicides (Source: National Vital Statistics Report.)
1995: Total suicide deaths in 1995: 31,284. Suicides involving firearms: 18,503
(Source: National Safety Council's 1998 Accident Facts)In 1995, suicides accounted for over 52% of all firearm deaths, while murder accounted for 44%, accidents accounted for 3%, and undetermined, 1%. (Source: National Safety Council's 1998 Accident Facts)
In 1995, there was 0.3 non-fatal firearms-related injury for each suicide.
Suicide and Homicide Rates in 86 Nations
The accompanying table gives suicide and homicide rates for all 86 nations for which data are available. Rates are per 100,000 population and come from the United Nations 1996 Demographic Yearbook published in 1998. Note that the latest U.S. suicide rate (for 1997) is 11.1, slightly below the 11.9 listed, while the 1997 U.S. homicide rate is 7.4 (as reported by the National Center for Health Statistics), far below the 9.4 listed here. Figures exceeding published U.S. figures are starred, while those exceeding only the most recent (1997) U.S. figures are doubly starred. The 1997 U.S. figures are preliminary. For a more contemporaneous comparison, the singly starred figures should be stressed.Please click on this hyperlink for a full analysis of the data provided below.
(RATES PER 100,000 POPULATION)
Nation |
Suicide |
Homicide |
Albania |
2.1 |
5.5 |
Argentina |
6.6 |
4.4 |
Austria |
22.2* |
1.0 |
Azerbaijan |
0.7 |
8.9** |
Bahamas |
1.2 |
10.8* |
Bahrain |
3.1 |
0.4 |
Barbados |
6.4 |
6.4 |
Balarus |
27.9* |
10.4* |
Belgium |
18.7* |
1.7 |
Brazil |
3.5 |
19.0* |
Bulgaria |
17.3* |
19.0* |
Canada |
13.4* |
1.7 |
Cape Verde |
2.4 |
1.7 |
Chile |
5.7 |
2.9 |
China |
17.6* |
1.4 |
Colombia |
3.5 |
80.0* |
Costa Rica |
5.0 |
5.6 |
Croatia |
22.8* |
3.3 |
Cuba |
20.3* |
7.8** |
Czech Republic |
18.6* |
2.1 |
Denmark |
22.3* |
4.9 |
Dominican Republic |
2.1 |
4.8 |
Ecuador |
4.8 |
13.4* |
Egypt |
0.0 |
0.5 |
El Salvador |
8.9 |
27.4* |
Estonia |
40.1* |
22.2* |
Finland |
27.2* |
2.9 |
France |
20.8* |
1.1 |
Georgia |
3.6 |
2.8 |
Germany |
15.8* |
1.1 |
Greece |
3.3 |
1.3 |
Guatemala |
0.5 |
1.3 |
Guyana |
1.7 |
0.3 |
Hong Kong |
11.8** |
1.2 |
Hungary |
32.9* |
3.5 |
Iceland |
9.4 |
0.4 |
Ireland |
9.1 |
0.6 |
Isle of Man |
9.9 |
1.4 |
Israel |
6.5 |
1.4 |
Italy |
8.2 |
1.7 |
Japan |
16.7* |
0.6 |
Kazakhstan |
28.6* |
19.4* |
Korea, South |
9.4 |
1.6 |
Kuwait |
1.9 |
1.7 |
Kyrgyzstan |
13.4* |
12.1* |
Latvia |
40.7* |
18.2* |
Lithuania |
45.6* |
11.7* |
Luxembourg |
15.4* |
0.7 |
Macao |
6.1 |
3.7 |
Malta |
4.1 |
0.8 |
Martinique |
12.8* |
4.3 |
Mauritius |
1.4 |
0.2 |
Mexico |
3.2 |
17.2* |
Moldova |
18.4* |
16.5* |
Netherlands |
9.8 |
1.2 |
New Zealand |
14.7* |
2.0 |
Nicaragua |
3.3 |
5.5 |
Norway |
12.3* |
0.8 |
Panama |
3.0 |
5.2 |
Paraguay |
2.3 |
9.8* |
Philippines |
1.3 |
11.5* |
Poland |
14.2* |
2.8 |
Portugal |
8.2 |
1.7 |
Puerto Rico |
8.8 |
23.8* |
Romania |
12.3* |
4.1 |
Russia |
41.2* |
30.6* |
Sao Tome |
1.1 |
15.1* |
Singapore |
13.4* |
1.8 |
Slovenia |
28.4* |
2.4 |
Spain |
8.1 |
0.9 |
Suriname |
12.9* |
1.5 |
Sweden |
15.3* |
1.0 |
Switzerland |
21.4* |
2.7 |
Tajikistan |
3.7 |
10.4* |
Trinidad |
11.8** |
11.7* |
Turkmenistan |
5.3 |
4.0 |
Ukraine |
22.5* |
11.3* |
United Kingdom |
8.0 |
0.9 |
United States (as per the United Nations) |
11.9 |
9.4 |
U.S.A. (as per the U.S. Dept. of Justice, 1997) |
11.1 |
7.0*** |
Uruguay |
10.3 |
4.4 |
Uzbekistan |
6.2 |
4.3 |
Venezuela |
5.1 |
15.7* |
Yugoslavia |
15.3* |
2.0 |
Zimbabwe |
7.5 |
6.9 |
*Figures exceeding U.S. figures at time of publication.
**Figures exceeding most recent (1997) U.S. figures, shown in parentheses.
***This rate decreased by over 7 percent in 1998 to 6.3
Source: United Nations 1996 Demographic Yearbook published in 1998Japan vs. the United States: murder and suicide rates
Japan's murder rate averages 0.6 per 100,000, but its suicide rate is 16.7, for a combined rate of 17.3 per 100,000. The U.S. murder rate averages 7.0 per 100,000, and the suicide rate is 11.1, for a combined total of 18.1 per 100,000. Thus, the combined murder and suicide rates in Japan and the U.S. are nearly equal even though firearms are virtually non-existent in Japan. (Source: National Safety Council's 1997 Accident Facts and the United Nations' 1996 Demographic Yearbook)There is considerable debate regarding the number of times firearms are used each year to fend off violent criminals. Much of the uncertainty is due to the fact that defensive gun uses are often limited to the would-be victim displaying a firearm which scares away the perpetrator. Such incidents are seldom reported to government agencies, which explains the lower estimates by such agencies. The annual estimates are as follows:
No. of Defensive Uses Source
2.1 million Point Blank: Guns & Violence in America, Gary Kleck
700,000 Mauser study
650,000 Hart study
108,000 1993 National Crime Victim Survey
76,000 1996 National Crime Victim SurveySignificantly, even using the lowest estimate, 76,000 violent crimes are prevented by armed citizens each year. Thus, the number of violent crimes thwarted by armed citizens is about four times the annual murder rate.
Total Firearms
The exact numbers are not known, but it is estimated that between 65 million and 80 million Americans own between 200 million and 225 million firearms. (Source: Department of Justice, National Rifle Association)Fully Automatic Firearms
As of 1995 there were over 240,000 machine guns registered with the BATF. About half are owned by civilians and half by police departments and other governmental agencies.Since 1934, only one legally owned machinegun has ever been used in crime, and that was a murder committed by a law enforcement officer in 1988.
[source: Department of Justice, Bureau of Justice Statistics, Guns Used in Crime and Targeting Guns: Firearms and Their Control, by Prof. Gary Kleck, 1997)
The Truth About the Kellermann Study claiming firearms increase your chances of being murdered by a factor of 43
Arthur L. Kellermann is an anti-self defense lobbyist with an axe to grind. The "study" was designed to produce a pre-determined result. The "study" is pure "junk science."Specifically, Kellermann claimed that "for every case of self-protection homicide involving a firearm kept in the home, there were 1.3 accidental deaths, 4.6 criminal homicides and 37 suicides involving firearms." (That adds up to 43.) Did you spot the gimmick?
At the end of his report, Kellermann stated his study did "not include cases in which burglars or intruders are wounded or frightened away by the use or display of a firearm." Kellermann considered only homicides. The "study" conveniently ignored all instances of home defense in which an intruder was not killed. If a would-be victim scared the intruder away with a firearm, that did not count. If the would-be victim wounded the criminal, that did not count, either. To count, someone had to be killed. This is dangerously misleading because if the victims were disarmed and unable to scare off intruders, most or all of the violent crimes would be completed, drastically increasing the incidence of rape, robbery and murder.
Further, 37 of the 43 deaths noted in the "study" were suicides. As the data above show (regarding the suicide rate in Japan, where firearms are virtually non-existent), a person who is intent on killing him- or herself will do it, with or without firearms.
Kellermann also admitted his study did not look at situations in which intruders "purposely avoided a home known to be armed."
In short, Kellermann ignored the vast majority of situations in which legally armed citizens frightened away intruders simply by displaying a firearm.
[Source: "Protected or Peril? An Analysis of Firearm-Related Deaths in the Home" by Arthur L. Kellermann and Donald T. Reay]
California Attorney General's Crime Data
Doctors for Integrity in Policy Research (DIPR)Doctors for Responsible Gun Ownership (DRGO)
Essays on Guns & Self-Defense
F.B.I.'s "1998 Uniform Crime Reports"Journalist's Guide to Gun Policy Scholars
Guncite
National Center for Policy Analysis (NCPA)
Scholarly Research
Transactional Records Access Clearinghouse (TRAC)
The preceding information was extracted from the GunTruths.Com website. Used with permission.